
Ames is a city in Story County, Iowa, United States, located approximately 30 miles north of Des Moines in central Iowa. It is best known as the home of Iowa State University, with leading agriculture, design, engineering, and veterinary medicine colleges. This project aims to help house builders in Ames, Iowa identify house features that
Data
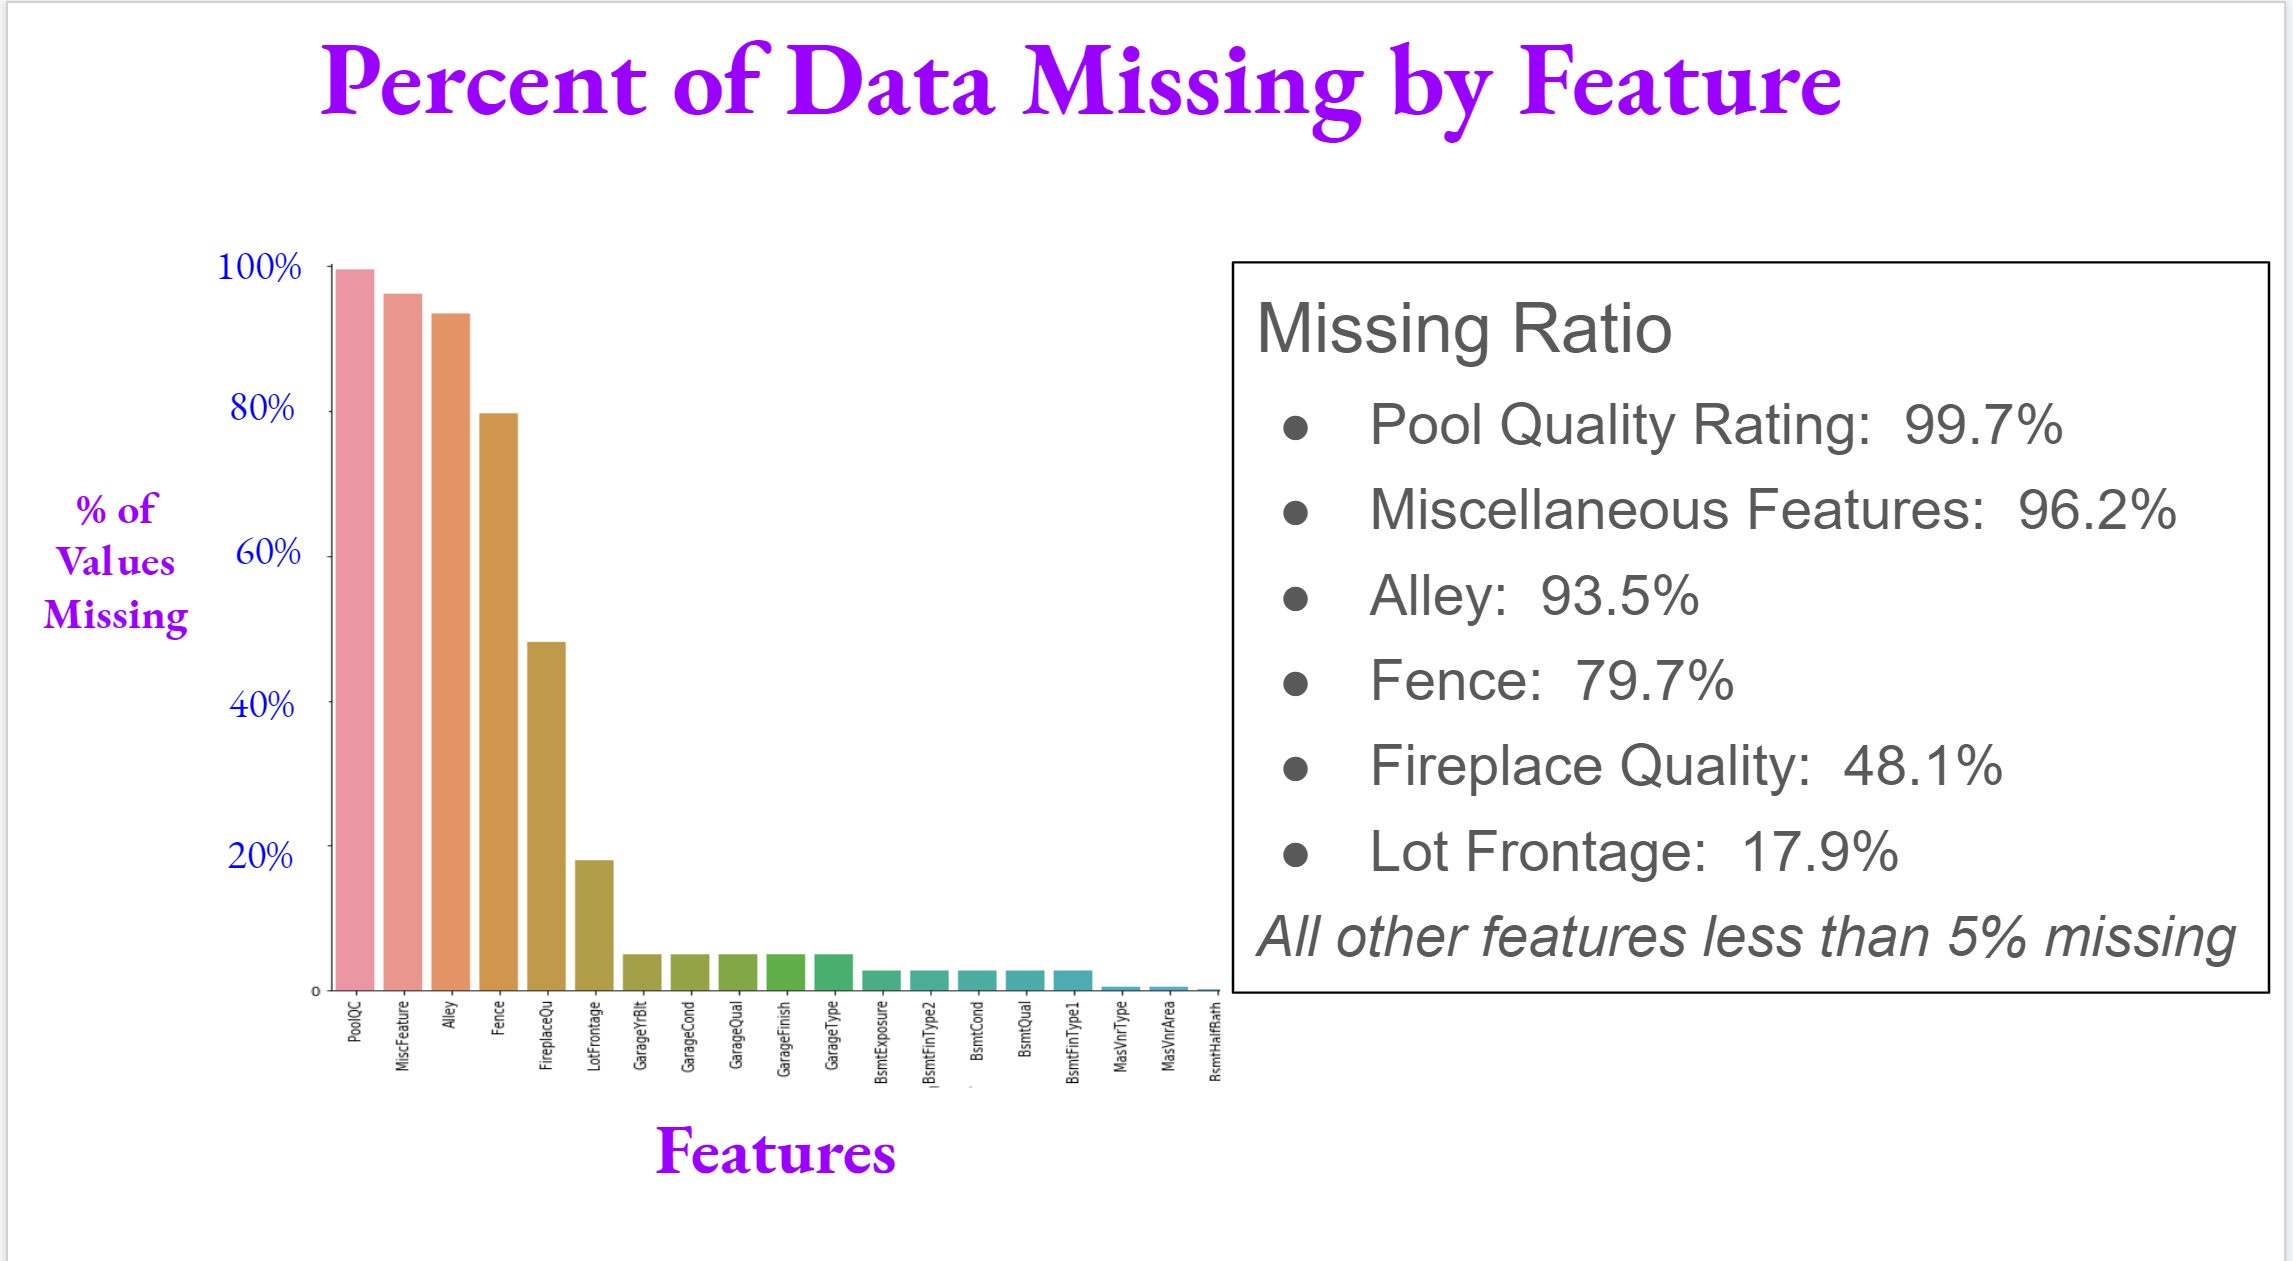
The Ames housing data set consists of about 2500 house sale records between 2006−2010 and with 81 columns including sale price as a target variable. We first analyzed the missing values and applied the necessary imputation.

These are the methods we used to impute missing values for each column:
- For Pool Quality Rating, Miscellaneous, Alley, Fence,
and Fireplace Quality: fill missing values with None. - For Electrical, Zoning Classification, Utilities, Home Functionality, Type of Sale, Kitchen Quality, and both the Exterior Covering features: fill with the mode, the most frequent value.
- For Lot Frontage feature: fill with the median neighborhood value.
Exploratory Data Analysis
We created a new column price per square foot which was derived from the sale price and a gross living area of the house. We used this variable to analyze the interaction with house features.
Overall and Kitchen Quality
How does the overall quality and kitchen quality influence price per square foot?
- As the overall quality of the house increases, the price per square foot increases.
- As the kitchen quality increases, the price per square foot increases.
Bedroom and Bathroom Combinations
Which combinations of bedrooms and bathrooms have the highest price per square foot?

- The price per square foot of a house was higher when the difference between bedrooms and bathrooms is 1 or less.
Central AC and Fireplace
Does Central Air Conditioning or a Fireplace affect price per square foot?
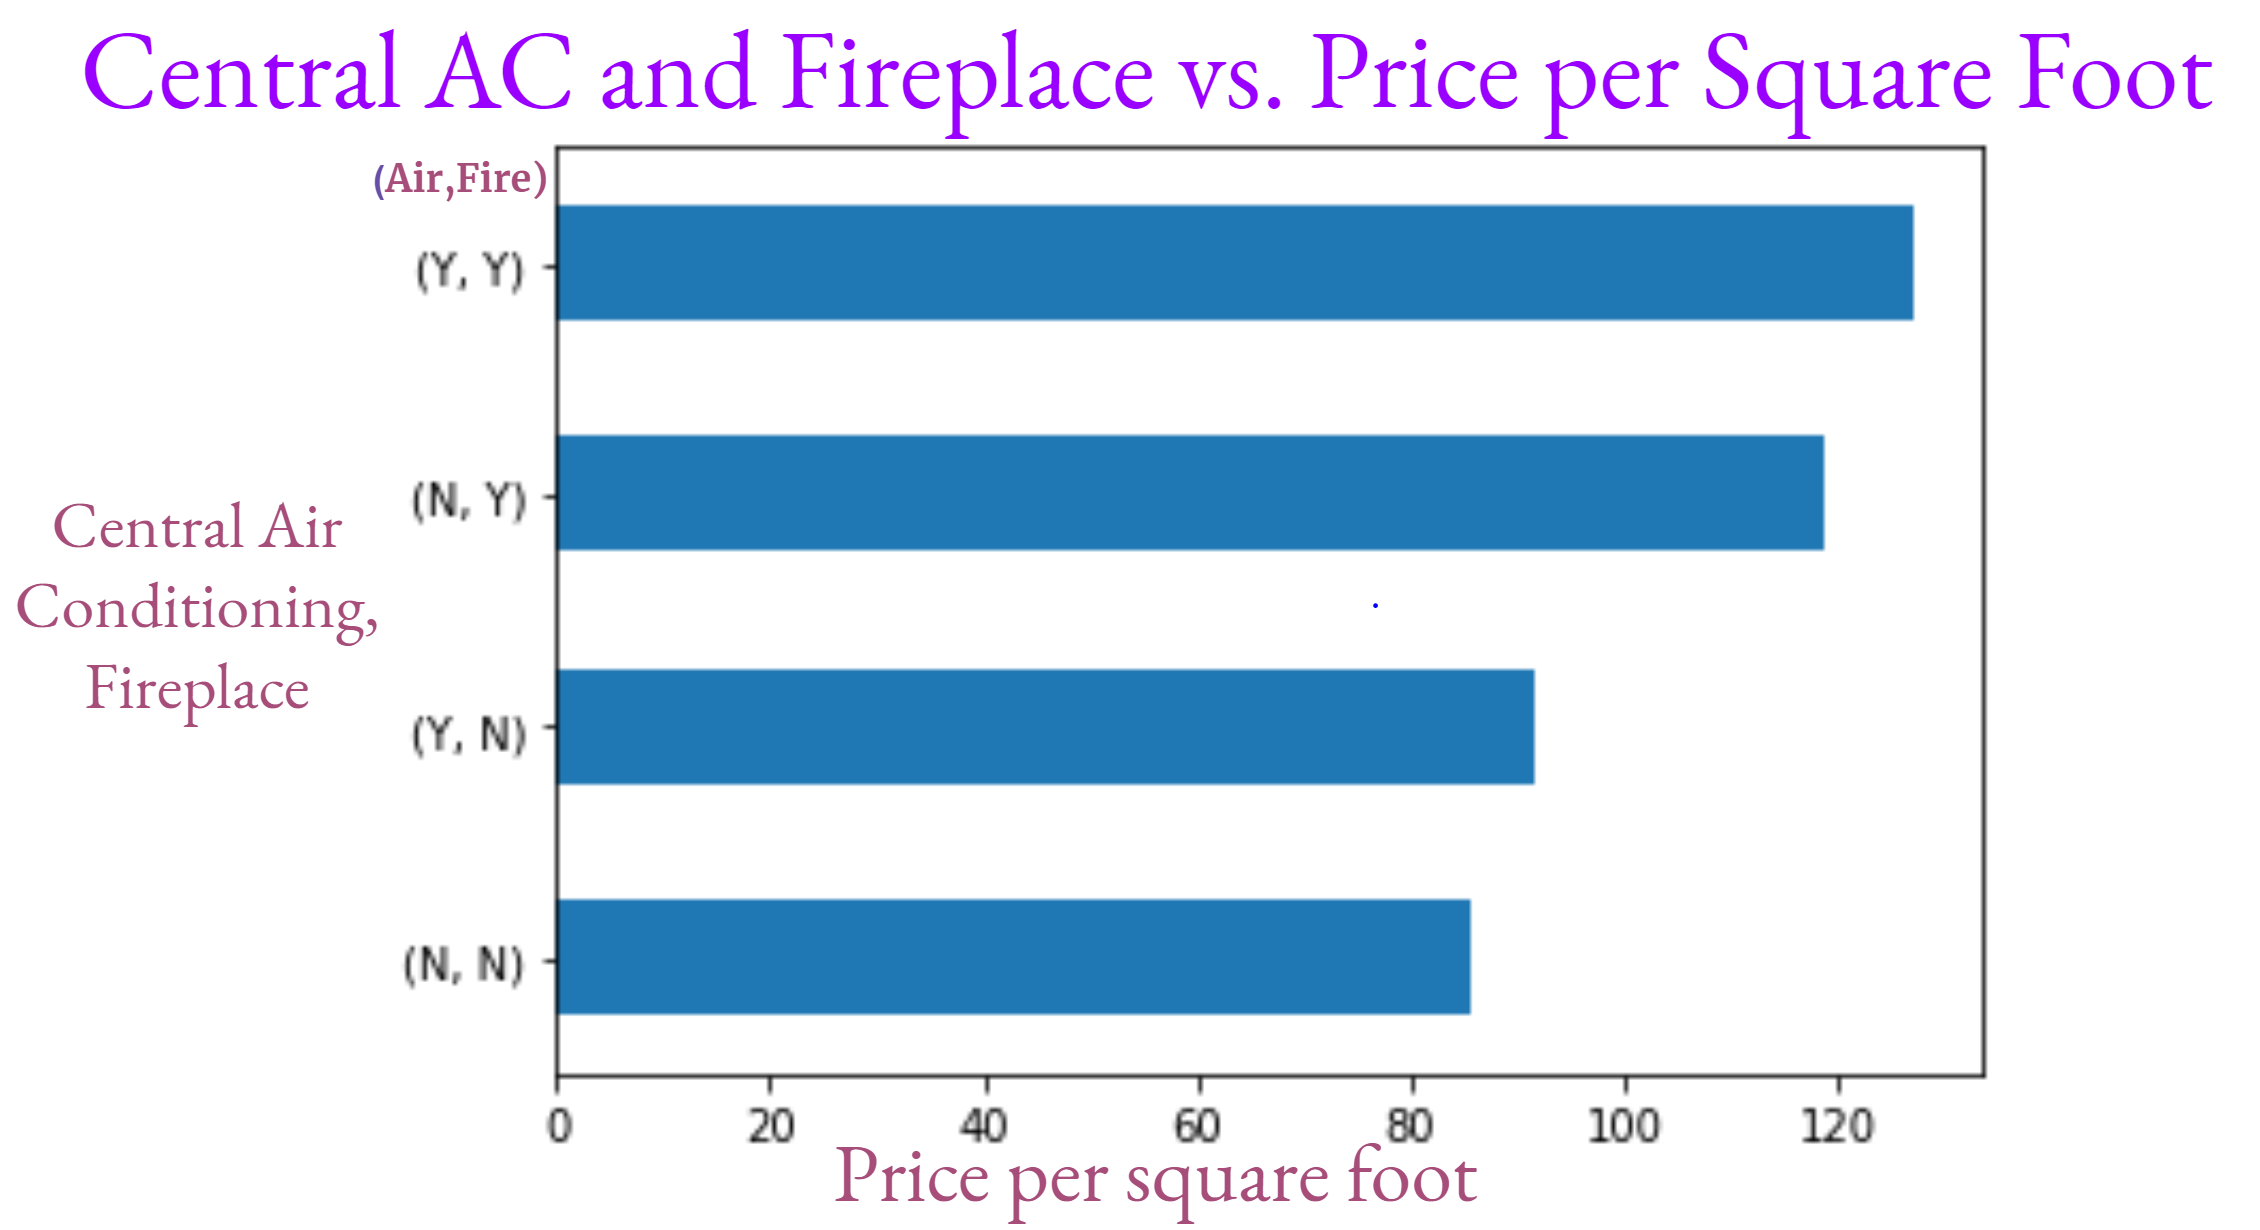
- Both features increase the price per square foot. But if you had to choose just one, Central Air tends to give a higher value, not surprising given Aimes average high temperature in the 80’s for the months of June, July, and August.
Age of the house when sold
How does the age of a house influence price per square foot?

- As the age of the house increases, the price per square foot increases.
Garage Capacity and Driveway
Do garage capacity or a paved driveway result in a higher price per square foot?

- A paved driveway with three car garage had a higher price per square foot.
We will use machine learning models to predict the sale price and select important house features. We will start by checking the response variable sale price.
On the left, the graph shows the sale price which is right-skewed. We use log transformation on the right, to make the sale price normally distributed. We will use the log-transformed sale price in fitting all machine learning models.

Stepwise regression using BIC
- In stepwise regression, we begin with a model that only has an intercept term, then sequentially adds the predictor that most improve the fit based on Bayesian Information Criterion(BIC). The better-fitted models are identified by smaller BIC values.
We first check the assumptions of Multiple Linear Regression such as normality, linearity, constant variance, independent errors, and multicollinearity.
Based on the plots, the assumptions for multiple linear regression were met.
Thes adjusted R-squared of the model is 0.9263. The following features were selected based on their importance.
OverallQual , GrLivArea , Neighborhood , BsmtFinSF1 , OverallCond, ageWhenSold , TotalBsmtSF, BldgType , GarageCars , Fireplaces , SaleCondition , CentralAir , LotArea , Condition2 , KitchenQual, BsmtExposure , YearRemodAdd , ScreenPorch , MSZoning, Functional, BsmtFullBath , EnclosedPorch , HeatingQC , PavedDrive , bb_diff , BsmtFinSF2
Penalized Linear Regression
The original MLR model is unbiased, but it often has a very high model
variance induced by multicollinearity of the features. To solve this problem, we will use Lasso and Ridge penalized linear models. With a suitably chosen lambda, the Lasso and Ridge will balance ‘bias-variance trade-off. And to find the best suitable lambda, we will use the sklearn’s GridSearchCV.

- The mean cross-validated score for lasso is 0.905 and for ridge is 0.904. This is the best score of the model with training data sets
- The performance score for lasso is 0.926 and for ridge is 0.924. This is the performance of the model with the test data.
- The models underfit a little but it is not a big concern
Random Forest Regressor
Random forest is an enhancement of bagging that builds a large
collection of de-correlated trees and then averages them. It introduces randomness in the individual tree generation process — at each tree node, the loss function is minimized only among a randomly chosen subset of features. To tune the parameters, we will use GridSearchCV.
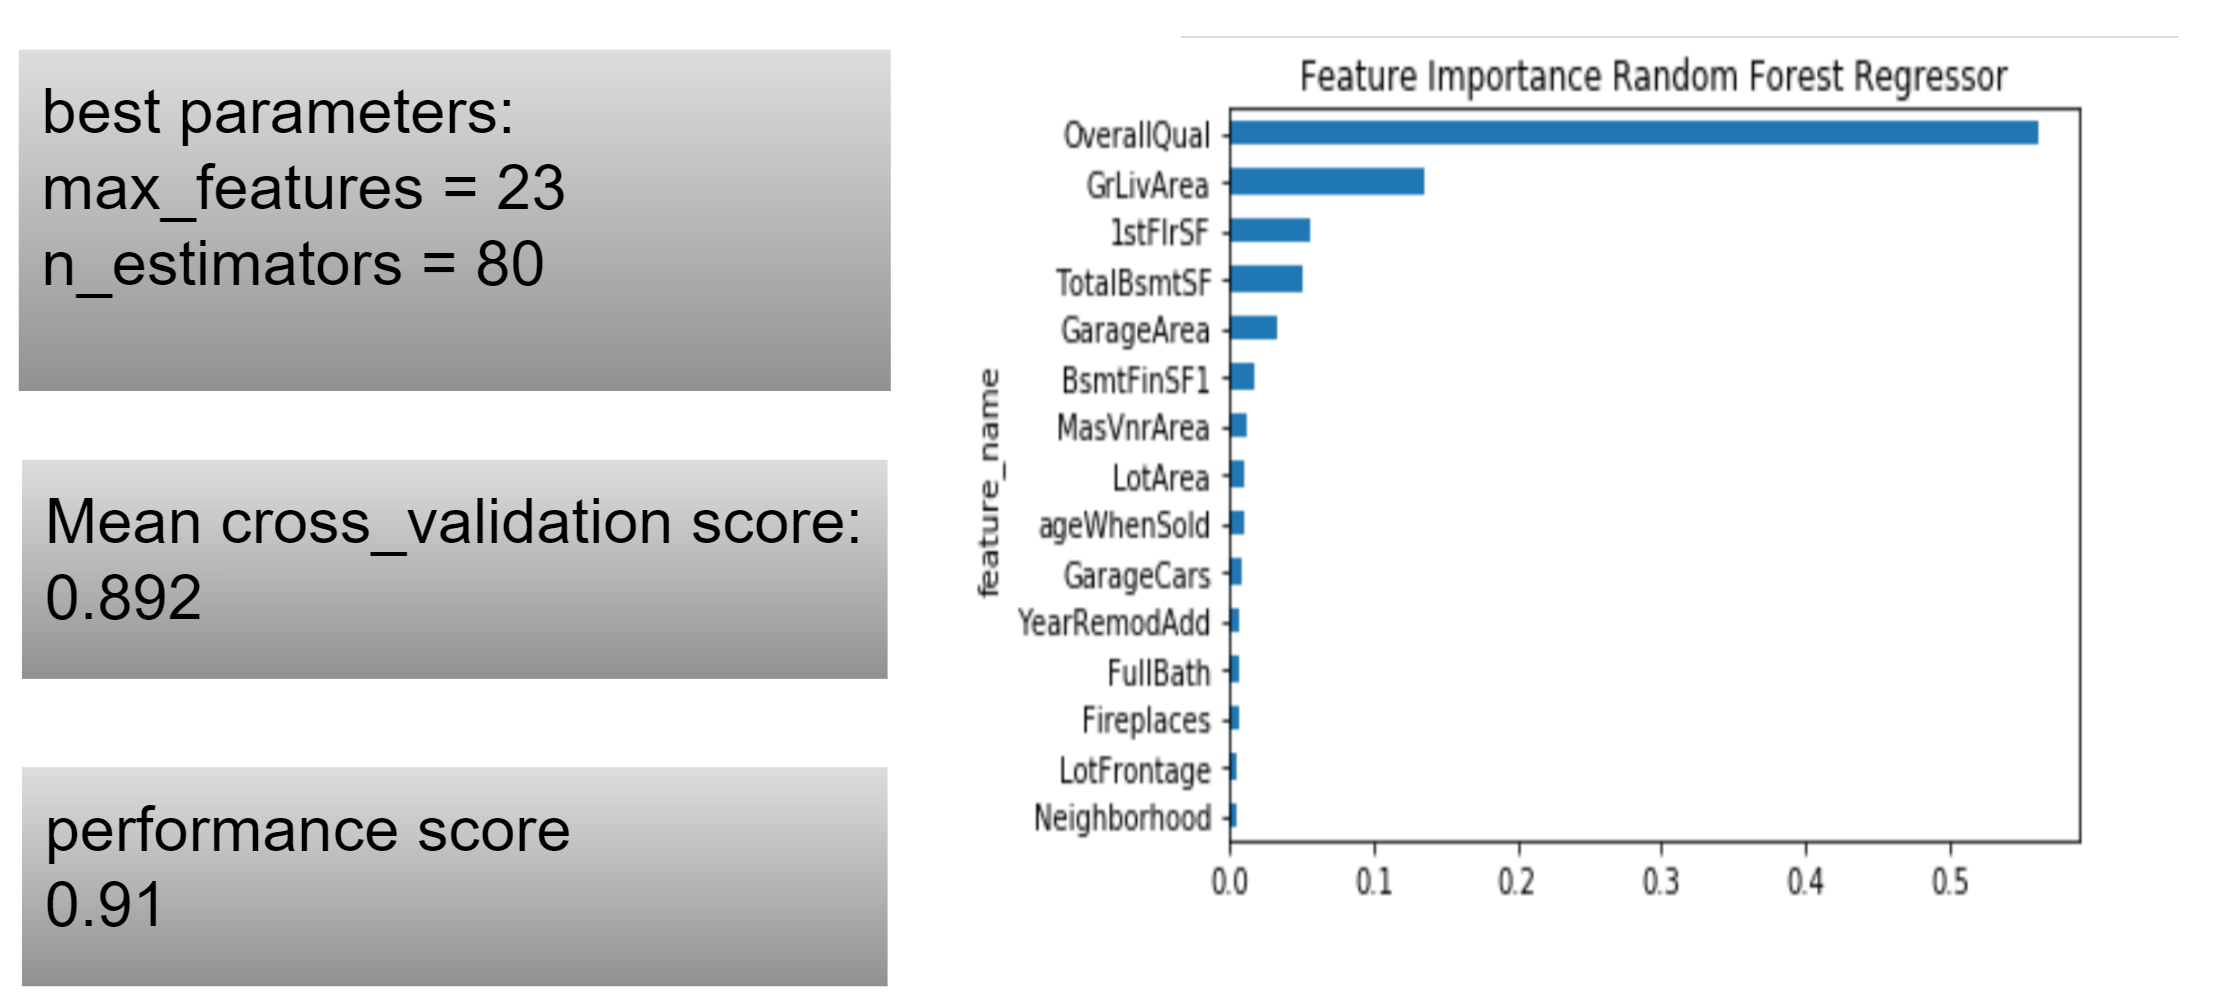
- The mean cross-validation score is 0.892 and the performance score is 0.91. This is slightly lower than the linear models.
- With the random forest model, the most important feature is the overall quality of the house then the gross living area, and first-floor square footage.
Gradient Boosting Regressor
Boosting is a very general sequential ensemble technique which
aggregates many weak learners to produce a strong learner. It differs from the parallel ensembling in that it produces a strong learner in a sequential way. Iteratively, the kth weak learner makes use of the previous k-1 weak learners’ outcome to make its own educated guess. GridSearchCV will be used to tune the parameters.
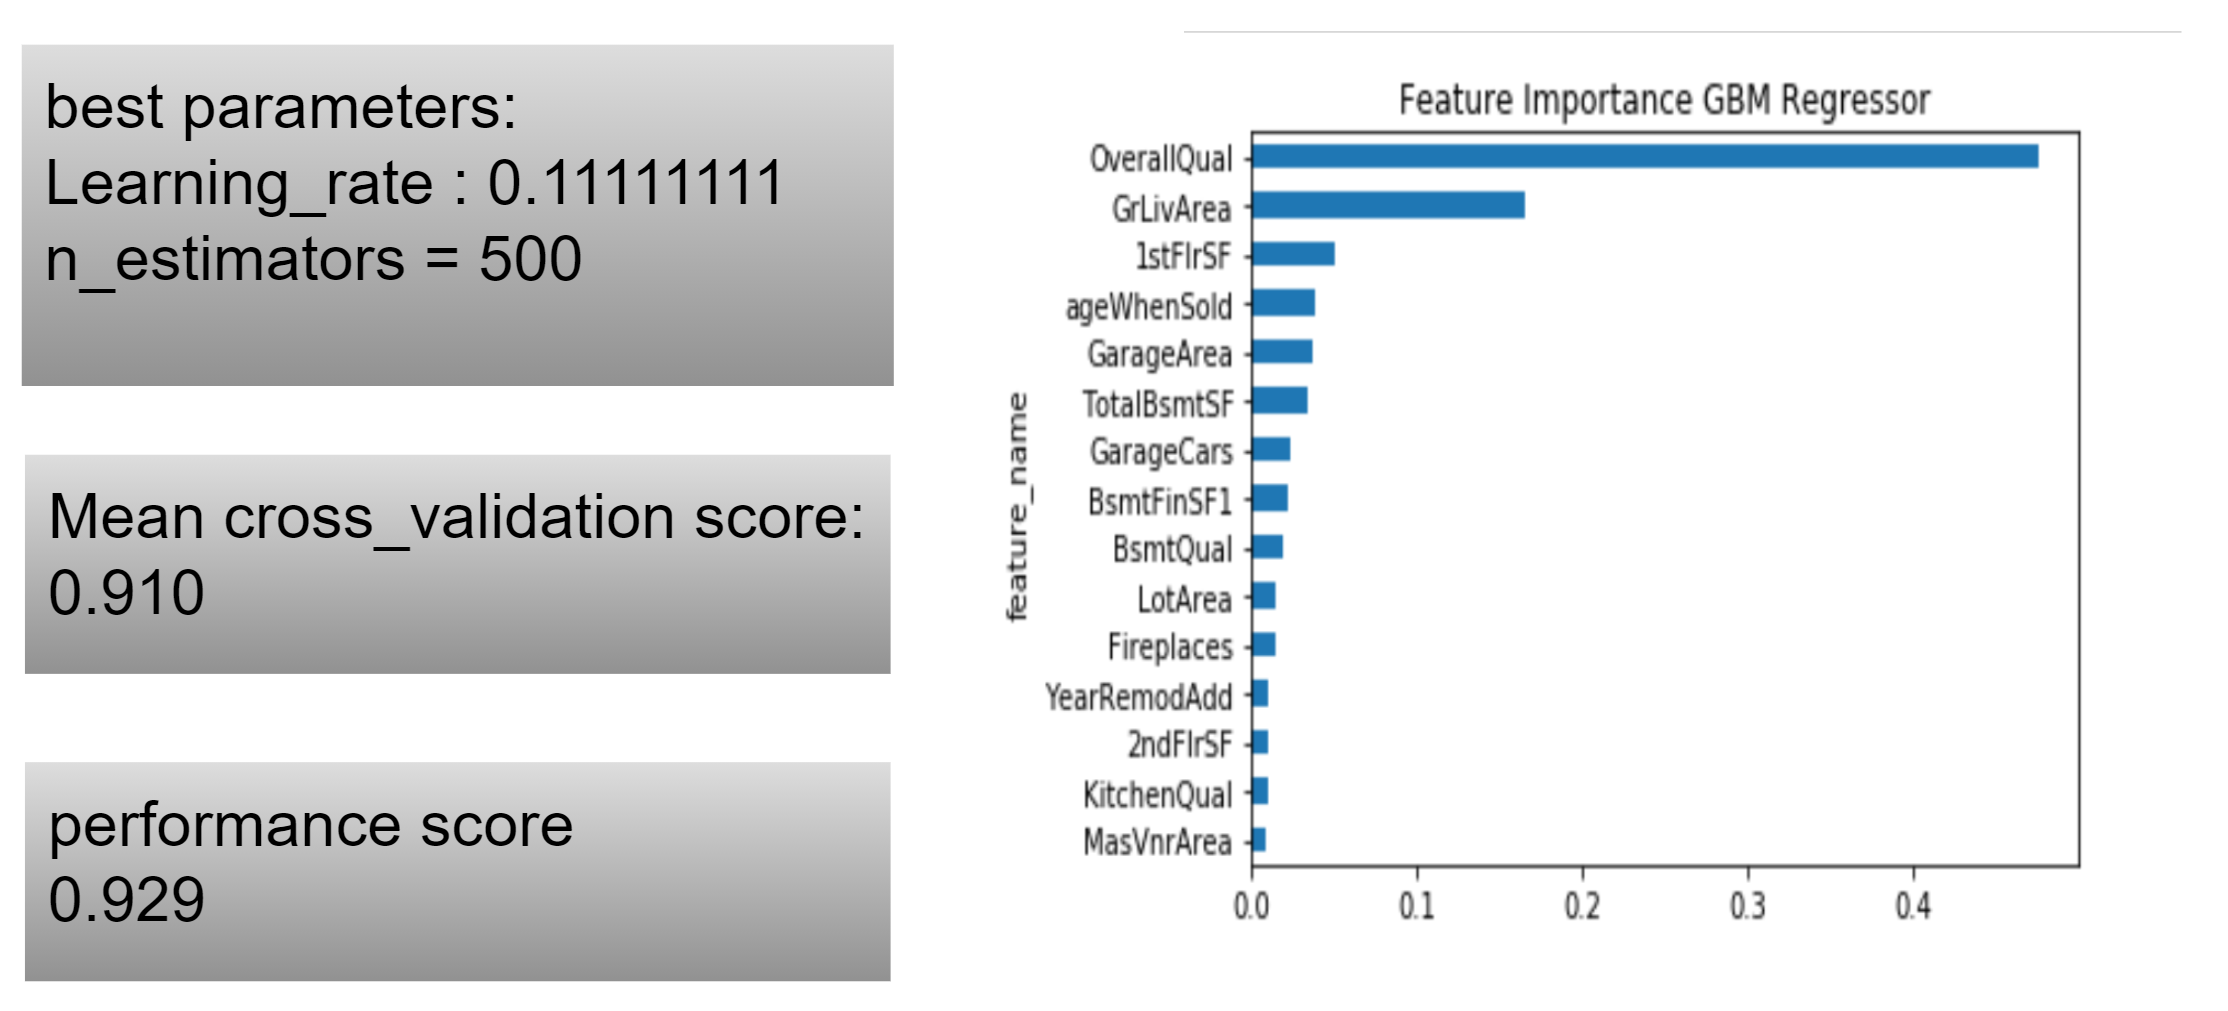
- The mean cross validation score is 0.910 and performance score is 0.929. The model’s performance score is the highest score among all models we tested.
- Overall quality is the most important feature. It is followed by gross living area and first floor square footage.
- Most of the important features were similar to the random forest model.
We believe that lasso regression is enough to model the data set. Though gradient boosting regressor has a higher performance but it is not enough to compensate for the cost to run the model.
Recommendations:
- Quality house
A point increase in overall quality rating increases sale price by 0.06%. - Excellent kitchen condition
Excellent kitchen quality sells 0.063% higher compared to other homes. - Choose a central air over a fireplace
Central air gives a 0.056% higher sale price compared with other houses. - Pave the driveway A home with a paved driveway sells for 0.048% higher than a home without one.
- Limit the difference between bedrooms and bathrooms to 1
For every one room increase between the number of bedrooms and the number of bathrooms, the average sale price drops 0.01%.

