
Overview/Abstract:
Online customer reviews of goods and services have become commonplace with the continued rise of e-commerce, and are a potentially valuable source of information for consumers and businesses alike. Prior research has focused on the distribution of online reviews as a whole and on the variations from platform to platform. Many studies have shown that multiple biases are present in consumer reviews, resulting in polarized and imbalanced data. This analysis focused on the distribution of Amazon.com customer ratings grouped at the product level, and applied the results to develop a tool that provides companies with insights into how their products compare to others on the site.
About Online Customer Reviews:
Significant research has focused on the investigation and characterization of online customer reviews. Allowing users to decide whether or not to leave a review leads to self-selection bias and high levels of polarization, with the majority of reviews left by customers who had very positive or very negative experiences. There is also a significant imbalance observed in the distribution of reviews, with the vast majority of reviews having a positive rating. Two previously hypothesized explanations for this imbalance are that people are likely to be satisfied by goods and services they decided were worth consuming (purchase self-selection), and that people are less inclined to be complainers and negative when their opinions can be seen by others. All of these factors result in general distributions of online reviews that have a distinct J-shape (some negative reviews, a few neutral reviews, and a large number of positive reviews). An important question is, given this skewed and biased data, can companies extract useful information from online customer reviews?
The Data:
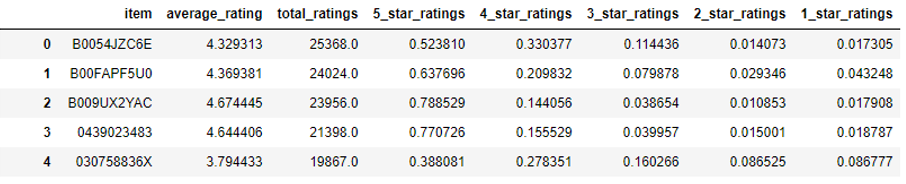
Given the numerous academic studies conducted on online customer reviews and the ease of accessing this information, there are many readily available data sources. This analysis was conducted using a dataset of 82 million Amazon.com customer reviews for 9.8 million unique products between 1996-2014. These were gathered by Julian McAuley of UCSD and used in the paper Ups and downs: Modeling the visual evolution of fashion trends with one-class collaborative filtering (He & McAuley, 2016). Using the unique product key and star rating from each review, the data was transformed to yield the average ratings and distributions of ratings when grouped by product.
Example of the transformed data used in this analysis.
Product Distribution Analysis:
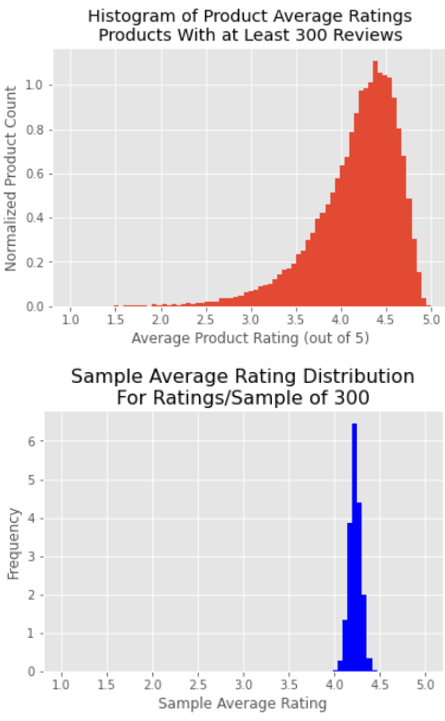
After grouping the reviews by product, the graphical representation of the average product rating distribution revealed neatly organized data. The data took on the appearance of a normal distribution with a very fat lower tail.
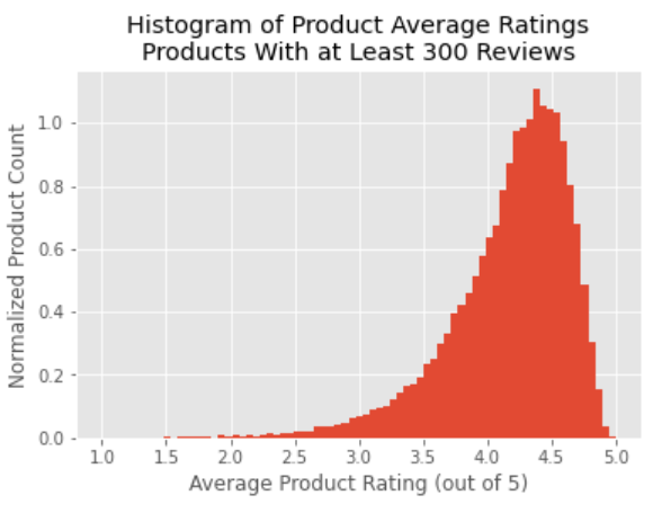
To investigate how the distribution of average product ratings would change from changes in the number of products included in the analysis, different cutoff levels were tested for inclusion based upon the minimum number of reviews per product. This metric makes sense to use as a sorting feature, since the average rating for a product is highly dependent upon the presence of infrequently observed negative product reviews. Without enough total reviews present, these negative reviews are unlikely to appear in a representative proportion. When varying the minimum review cutoff level from 25 reviews per product up to 300 reviews, resulting in between 25,000 and 500,000 reviews included in the analysis, the average product ratings distribution stayed remarkably consistent. This robust relationship between the specific products included in the analysis and the distribution of average product ratings leads to the conclusion that the ratings of a set of products depends on the ratings behavior of consumers and not on how frequently-reviewed a product is.
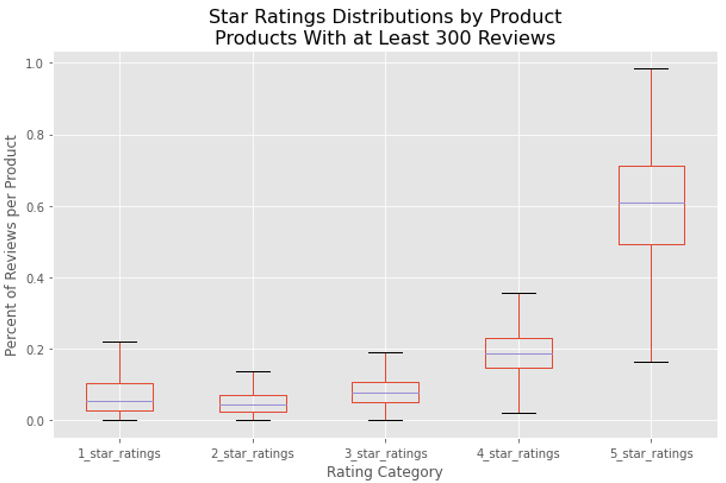
In addition to the average rating distribution being robust to changes in the minimum review cutoff level, the observed proportions of individual ratings levels per product was found to be relatively stable with changes in the number of products included in the analysis. The consistency of these distributions shows that the conclusions that can be drawn are applicable to the universe of products on Amaxon.com, as the average ratings distribution is independent of how many times products have been reviewed.
With this information, it was a straightforward process to create a cumulative frequency table for average product ratings of products on Amazon.com. This allowed for the placement of a product with a given average rating into a percentile of all products on Amazon.com, a valuable insight for businesses who sell products on the site.
Sample Size Analysis:
The next important question to address was how many reviews an individual product needed in order to have a meaningful average rating. Without a large enough number of reviews, the presence (or lack of presence) of just a few negative reviews could greatly change the average rating observed. In order to analyze this, random sampling was conducted on a ‘typical’ item to observe the sample outcomes from a population with known characteristics. To choose the item to conduct random sampling upon, the dataset for individual item averages was filtered for ratings distributions close to the median proportions for each star-rating level, and then ordered by number of reviews. The individual item chosen had a very ‘typical’ distribution and a large number of reviews (14,114). Five thousand trials were then drawn from this set of reviews, with differing numbers of reviews per trial in different sets of tests. By the time the number of reviews included per trial climbed to 300, 90% of the observed averages fell within roughly +-0.10 stars of the true product average.
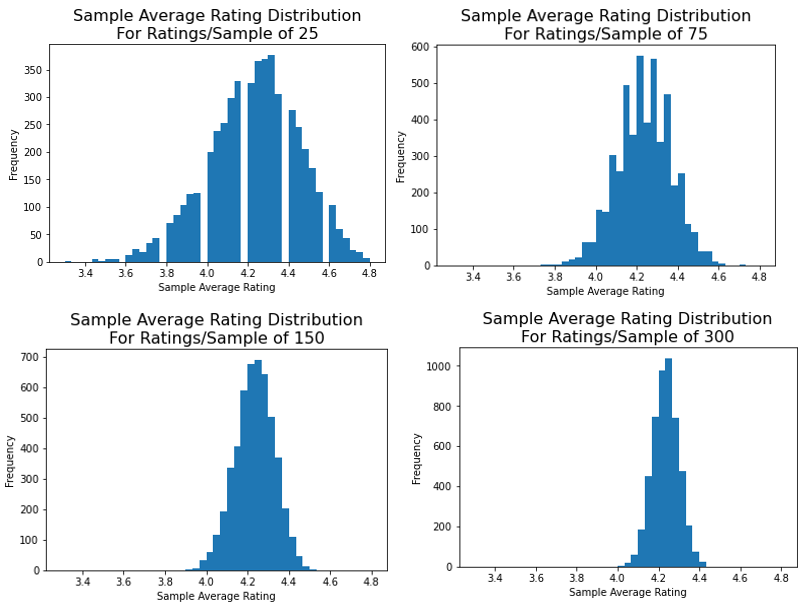
When compared to the distribution of average product reviews found earlier, a variation of +-0.10 stars in the accuracy of an individual product’s average rating allowed for meaningful information to be extracted from the ranking of a product compared to others on the site. This random sampling process was how a cutoff level for minimum reviews per product of 300 reviews was determined for this study.
Results of Analysis:
Lets recap the findings of this analysis of online customer reviews on Amazon.com grouped by product. It was determined the median product on Amazon has an average rating of about 4.27 stars, where 61% of the reviews were 5-star ratings and 5% of the reviews were 1-star ratings. Importantly, a cumulative frequency table was constructed allowing the placement of a product with an average customer rating into a percentile of products on Amazon.com. Another key result of the study was that a product should have at least 300 reviews in order to extract meaningful information from its average customer rating.

Reviews Analysis Tool:
With the analysis completed, it was time to put these results into action. The final product of this study was a tool to help companies extract information from online customer reviews of their products sold on Amazon.com. Concise, aggregated datasets were generated to aid in the speedy functioning of the tool, and a python script was created to run straight from the command line. Consideration was given on what to output to the user for providing useful information and to inform them of the limitations of the results. It can be difficult to provide sufficient context for the appropriate use of a program’s results to users who don’t really understand the underlying model, and the development of this tool was no different. In addition to providing the percentile rank of a product with an inputted review distribution, a message was outputted providing the 90% confidence interval of the result as well as steps that could be taken to tighten up the confidence interval in the future.
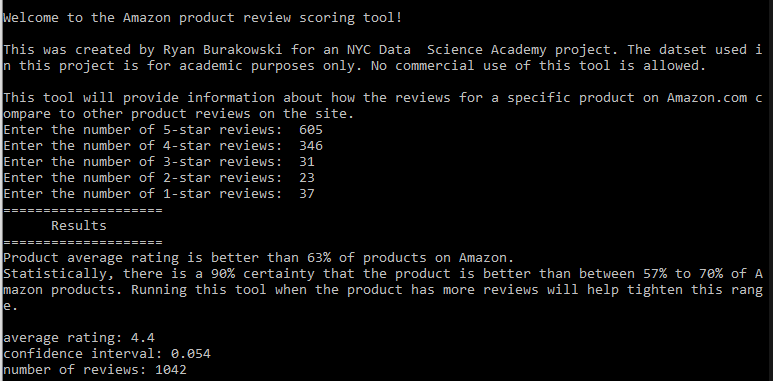
Snapshot of the Amazon product review tool running in the command line interface.
Future Extensibility:
This tool allows companies to extract meaningful insights from the online customer reviews of their products on Amazon.com despite the biased and skewed nature of reviews. There appears to be multiple useful paths forward for this analysis and the reviews comparison program itself, by applying this methodology to new domains and going deeper into the analysis of each product. This analysis could be expanded to a wider set of online sites that have customer reviews, in particular to those with services/business reviews like Yelp.com. In addition, using post-COVID data could help investigate whether customer reviewing behavior has changed with the wider demographic and increased prevalence of online shopping during the pandemic. . A third area of expansion for this tool is the application of natural language processing to extract frequently cited praise or criticism in positive or negative reviews. This would transform the tool from being a descriptive analysis of a company’s product into a prescriptive suggestion of methods for product improvement.

