
INTRODUCTION
Having studied the effects of invasive pest species on agriculture as a graduate student, I understand the increasing necessity for pesticide use. With the planet hosting a population expanding well over 7 billion, the need to maximize food production to feed all those people has become a high priority. Pests, causing financial losses in the hundreds of billions, cause farmers and corporations go to great lengths to protect their agricultural products from the 7 thousand approximate species that hamper their industries.
While there are a wide variety of pest control strategies in use globally, a class of pesticide, Neonicotinoids, saw use for almost 20 years in the United States starting in 1990’s, with a reduction in use, and sometimes a complete disuse altogether, only beginning in 2017. This class of pesticide works by attacking specific points in the nervous system, preventing it from functioning properly, and ultimately resulting in death. While very effective, they unfortunately are not selective in design, and are toxic to humans and pollinators alike. One of the most crucial pollinators to our agricultural industry, the honeybee, was no exception. The scientific community has kept a close eye on the slowly declining population of honeybees around the world, and it is possible that with that decline, a drop in extant plant species may follow
THE DATASET
Due to the financial and scientific benefits that come from understanding this type of information, I chose a dataset that was aggregated from the National Agricultural Statistics Service (NASS), the USGS, the US Census, and the USDA, that covers honey production, pricing, value and yield, in conjunction with the neonic pesticide use in the corresponding part of the United States. The data spans from the early use of neonic pesticides in 1998, all the way to its decline in use in 2017. In my analysis, I chose to focus on the top ten honey producing states from the dataset. RStudio, ggplot2, dplyr and tidyr were used to refine, process and analyze the dataset, and a RShiny app was developed to interact with the data in a user friendly way. The original dataset can be downloaded from (Kaggle), the github repository (here), and the app can be accessed (here).
WHAT TO LOOK FOR…
Many arthropods, especially honeybees, are very sensitive to environmental factors, both biotic and abiotic in nature. A change in weather, chemical runoff, land development, disease and food availability, can have drastic effects on honey production and honeybee health. Honey production may vary dramatically year to year, due to these ever changing factors, so to start, one wants to look at the long term effects. Do we see any significant changes from when neonic pesticide use began, and do we see any lingering effects from after it ended.
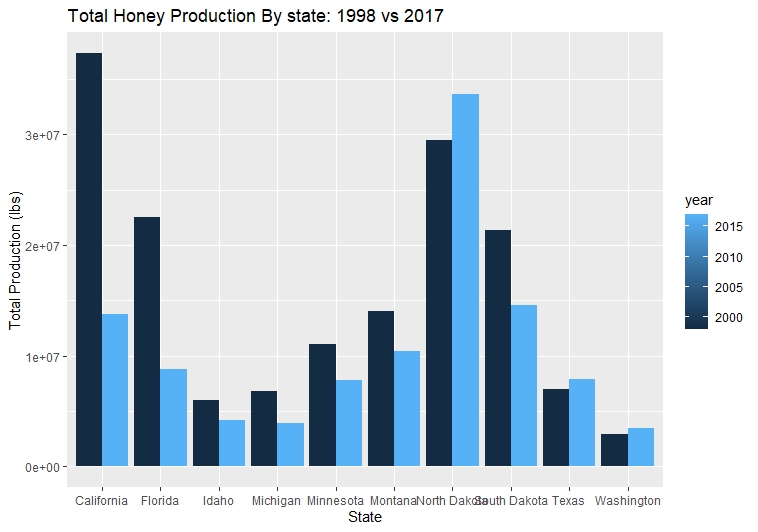
Here we can see illustrated, the total production (lbs) of honey per state, in 1998 (dark blue) and the more production figures from 2017. Of these ten states, overall, there was no significant difference in collective honey production between 1998 and 2017, however, you can easily see that the changes vary from state to state. Some show increases in production, and many show decreases, but only a handful show any visually striking changes. The biomes of these states differ dramatically, and many factors can be the cause of these changes specific to those locations.
POSSIBLE RED FLAGS
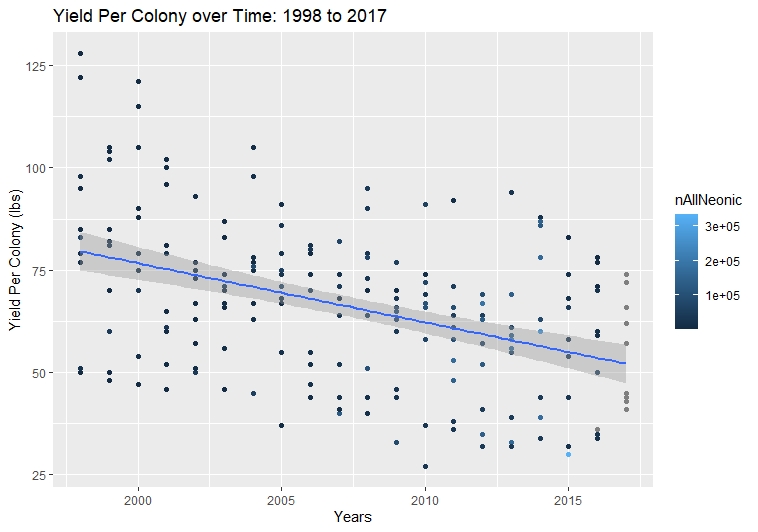
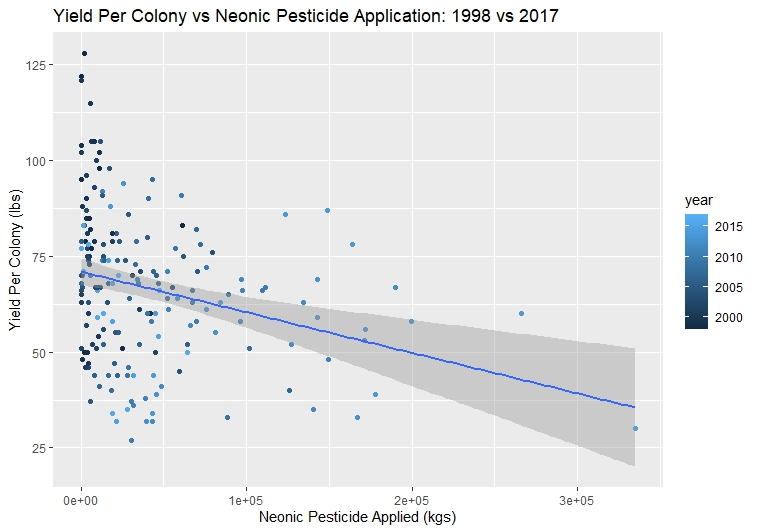
If we take a look at the difference in honey yield per colony over a 20 year period, statistical analysis shows that there was a significant change in yield per colony with the use of pesticides, and that this change is also visible when compared to increasing levels of neonic pesticides.