

Our team did a thorough analysis of the Ames, Iowa Housing dataset and trained several machine learning models to predict house prices. We also deployed one of these models in a web-app to help potential buyers find the right house based on their budget.
Background
The data was collected by Dean De Cock in 2001 as an alternative to the famous Boston Housing Dataset as a tool for teaching linear regression. The data consists of 2930 sale prices for houses sold in Ames Iowa from 2006 to 2010, along with over 80 explanatory variables for each house. This dataset can be found on kaggle.
Our group was inspired by the popular “house hunter” style television shows to use machine learning to help home buyers find their home. The requirements were to take someone’s requirements for a house (size, number of bathrooms, etc.) and predict what their house would cost. Our value proposition is that if their predicted house did not match their budget, we could also analyze what things to add or remove in order to reach their budget and find their dream home.
Pre-Processing
Data quality is an important topic in machine learning. The old adage of “garbage in, garbage out” especially applicable here. Therefore, we combed the data to remove as many low quality rows from the data as possible. For instance, the data included home sales under foreclosure, houses that were severely damaged, and homes zoned for agriculture on 40 acres of land. None of these are appropriate for analyzing an average family home, so they were dropped. In total, 400 rows were removed from the data. This was acceptable, because 2,000 rows still remained, which is plenty for data analysis and machine learning.
Tree-Based Modeling
The advantage of using tree-based models is for early feature selection. By analyzing the features higher up on the decision tree, we can draw conclusions about what feature are more important to predicting the house price. This is convenient when we have over 80 variables to consider.
Feature Engineering Pt. 1
We were guided in our feature selection and feature engineering through the information we acquired during exploratory data analysis. For instance, we created a curb appeal feature that was a combination of 11 of variables likes: masonry veneer area, lot frontage, lot shape, land contour, lot configuration, land slope, roof style, roof material, exterior material, exterior quality, and exterior condition. We also download the latitude and longitude coordinates of each house and calculated the distance to the big college in town (Iowa State).
Model Results
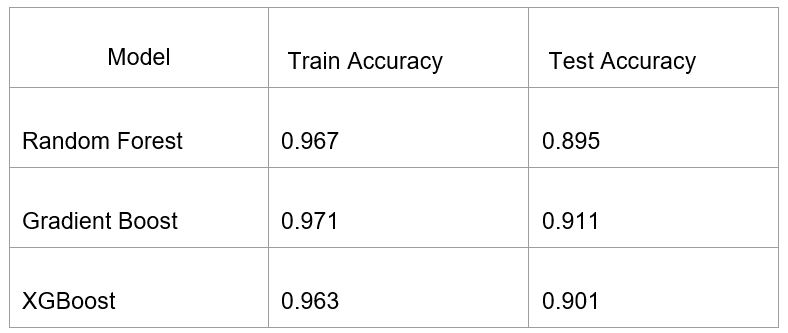
We used three different tree-based models: Random Forest, Gradient Boosting, and XGBoost. All three were tuned using grid searches, and performed similarly in terms of accuracy. The average test accuracy was around 90%, which means that the model could a house on average within 90% of the sale price. We also saw a 6% error between the train and test sets, so we may have had a problem with overfitting. However, the Gradient Boost model performed slightly better than the other 2 models with slightly higher train and test scores and just a slightly lower error.
Feature Selection Pt. 1
Now that we had an accurate model, we can use the decision trees to analyze the important variables.

The above diagram shows the top three levels of a single decision tree from the Random Forest Model. Decision trees make splits on the features that return the largest information gain. In the tree above, the first split has been made on the overall quality feature, so the cut on this feature provided the most information. In the second level, the splits are on curb appeal and neighborhood. Therefore, this reveals that for homes with lower overall quality < 7.5, curb appeal is the most important feature, but for homes with higher quality > 7.5, the most important feature is the neighborhood. Note: this could be insightful for a real estate expert, but may be hard for new home buyers to interpret.
On the other hand, something we can interpret is a ranking of which features are the most important. This graph is a ranking of how high each variable is in the tree, and we can use it to inform our next round of modeling.

Linear Modeling
The advantage of using linear models in house pricing is their interpretability. As we saw earlier, tree-based models can be difficult to interpret. On the other hand, a linear model will have a straightforward formula where the house price might equal $20 times the square footage + $1,000 times the number of bedrooms + $500 times the number of bathrooms.
Feature Engineering Pt. 2
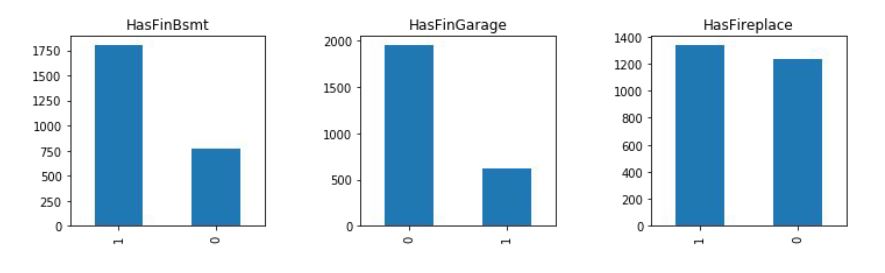
In order to make the model useful to a home buyer, we had to engineer several more variables based on different house features like, does it have a finished basement? does it have a garage? does it have a fireplace?
Feature Selection Pt. 2
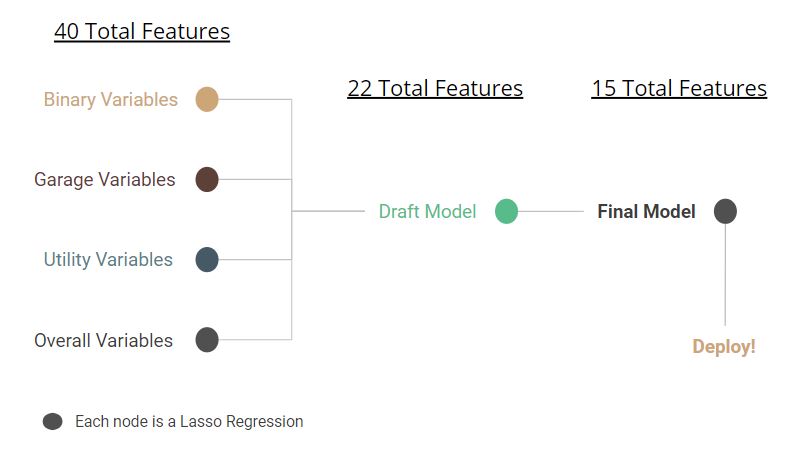
After combining our newly engineered features with the important features from the tree-based models earlier, we had 40 features to consider for our linear model. We could tell that some of these features were correlated, which meant they were redundant in a linear model and had to be dropped.
In order to systematically drop redundant variables, we used a series penalized linear regressions, specifically Lasso Regression. In a Lasso Regression, the model will set the coefficient of an input variable equal to zero if that variable is redundant. Using this strategy, we narrowed the number of features down to just 15.
Final Model
Using this strategy, we narrowed the number of features down to just 15. We found that the five most important features of a house in Ames Iowa are:
- Total Living Area
- Whether or not it has central air
- Total Lot area
- Whether or not it has a finished basement
- Overall quality of the house (1-10 scale)
We used two scores to measure our model: coefficient of determination (R^2) and mean standard error (MSE). The R^2 was 88%, which means that our model explains 88% of the fluctuations in house price. The MSE was $17,000, which means that on average, our model predicts within $17,000 of the sale price.
Web Application
Now that we have a linear model that is tuned for our target user, we needed to create a dashboard so home buyers can interact with the model. We created a dashboard with the Python Dash library and deployed the app on Heroku. The app can be accessed here: https://ames-housing-app.herokuapp.com/
The dashboard allows users to enter their budget and specify features they would like in their house such as gross living area, lot area, neighborhood, qualities and other features as shown below:

The selected features become inputs into the linear model, and the output is a predicted housing prices. The dashboard compares the user’s budget and the predicted price and recommends 10 changes that the user can make to bring the target price closer to their budget. The recommendation system subtracts or adds features depending on whether the user is over or under budget and predicts a new price. The top 10 changes that bring the target price closest to the budget are shown to the user.


